The problem with missed calls
For service-oriented businesses, a missed call is rarely just a missed call. It often represents a customer who tried to reach support, could not, and either called a competitor or began forming a negative impression of your team's responsiveness. The challenge is that most phone systems tell you that calls were missed — not why, when, or by whom.
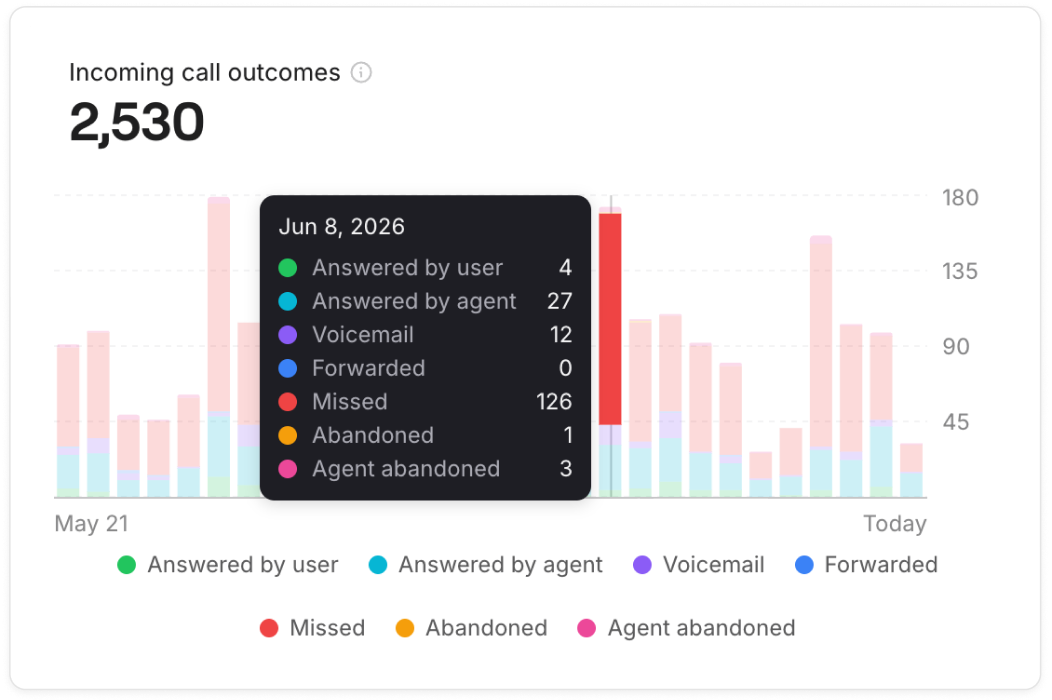
Quo's incoming call outcomes chart addresses this gap directly. Rather than a single 'missed calls' counter, it breaks every inbound call into one of seven outcome categories and renders them as a stacked bar chart with daily granularity, making the diagnosis of call leakage straightforward.
Reading the outcomes chart
The chart visible in Quo's Analytics section for June 8, 2026 shows 2,530 total incoming calls distributed across the following outcomes: Answered by user (4), Answered by agent (27), Voicemail (12), Forwarded (0), Missed (126), Abandoned (1), and Agent abandoned (3).
The color-coded stacked bars make the ratio of productive outcomes (Answered) to leakage outcomes (Missed, Abandoned, Agent abandoned) immediately visible. In this snapshot, Missed calls at 126 represent the dominant leakage category — roughly five times the volume of answered calls — which is the first signal a team lead should investigate.
126 missed vs. 31 answered: the stacked bar makes the ratio impossible to ignore — that is the design intent.
Seven outcome categories explained
Answered by user refers to calls picked up directly by an agent who owns the inbox. Answered by agent is broader and captures any team member who answered regardless of assignment. The distinction matters when you are evaluating routing rules: if 'Answered by user' is consistently low, your routing may not be directing calls to the right owner.
Voicemail captures calls that reached an answering box — planned fallback. Forwarded captures calls redirected to another number — also expected. Missed is the critical metric: calls that rang without any pickup or routing outcome. Abandoned means the caller hung up before the call was answered or routed. Agent abandoned is a notable category unique to inbound queues: it captures calls that an agent picked up and then immediately disconnected — a signal of accidental answers, technical issues, or deliberate avoidance.
Using daily granularity to find patterns
The date filter above the chart allows teams to select a custom date range with daily or hourly granularity. When diagnosing a spike in missed calls, the first step is to zoom into the affected date range and look for the days where the Missed segment expands disproportionately in the stacked bar.
Common patterns include: Monday and Friday spikes (staffing at the week's edges), lunch-hour dips (predictable understaffing windows), and post-holiday catch-up days (abnormally high volume against normal staffing). All three patterns become visible within two minutes of opening the outcomes chart in Quo.
Actionable fixes for high missed-call rates
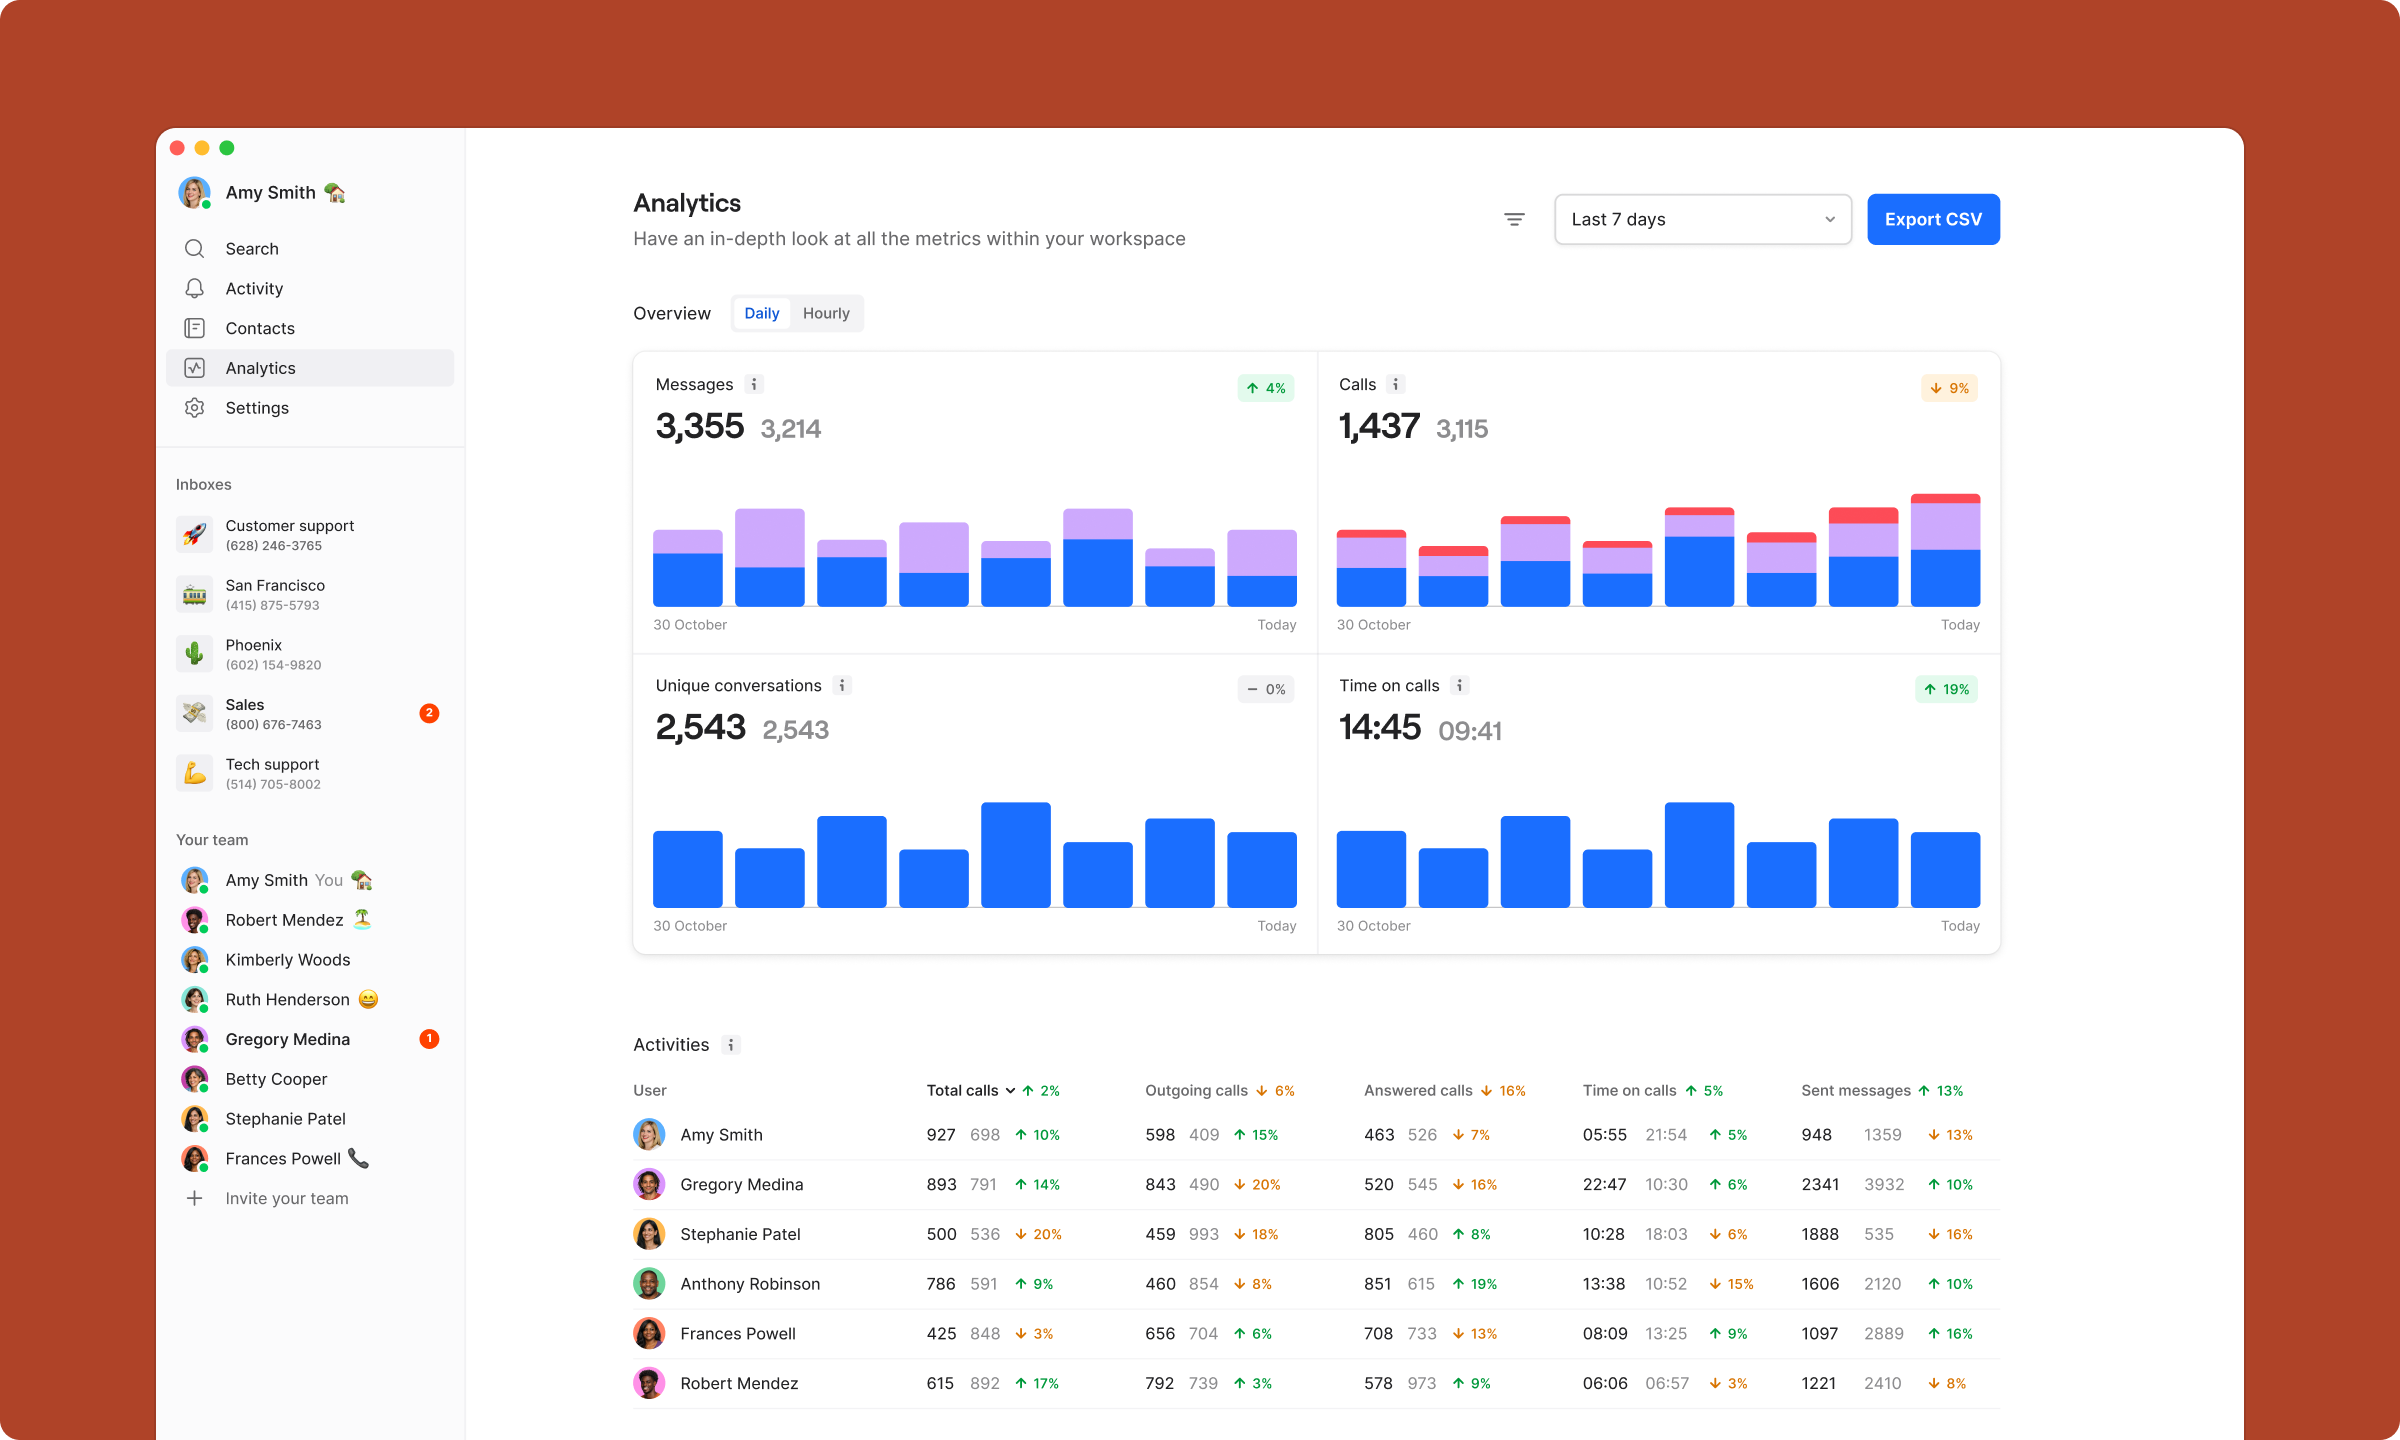
After identifying the pattern, teams have four operational levers. First, adjust routing rules so that calls missed by the primary agent automatically ring one or two backup agents before going to voicemail. Second, configure business-hours automation to set clear expectations for after-hours callers rather than letting calls ring unanswered. Third, use Quo's agent activity table — covered in our Analytics dashboard review — to identify which agents have the lowest 'Answered by agent' rate during peak hours and schedule accordingly. Fourth, enable voicemail transcription so that callers who do reach voicemail get a same-day callback rather than falling through the cracks.
Routing rules, business-hours automation, agent scheduling, and voicemail transcription — four levers to close the missed-call gap.
Verdict
The incoming call outcomes chart is one of the most practically useful reporting features in Quo. It moves the conversation about call performance from 'we had a lot of calls' to 'we missed 126 of them, primarily on these days, and here is what to change.' That shift from volume reporting to outcome reporting is exactly what growing teams need to hold their communication layer accountable.
Paired with the per-agent activity table and the call log filter (covered separately), the outcomes chart gives team leads a complete picture of where calls go and why.