What is Quo?
Quo is a multi-channel business communication platform built for support and sales teams that run a high volume of inbound and outbound calls alongside digital messaging. Unlike generic helpdesk tools, Quo organizes work around inboxes — each mapped to a phone number or channel — and gives managers a real-time operational picture of every inbox, every agent, and every conversation.
The Analytics & Oversight module is the control center of that picture. From a single screen, team leads can track message volume, call counts, unique conversations, and time-on-call across configurable time windows — daily, hourly, or by custom range — and export the raw data to CSV for deeper analysis.
The Analytics dashboard at a glance
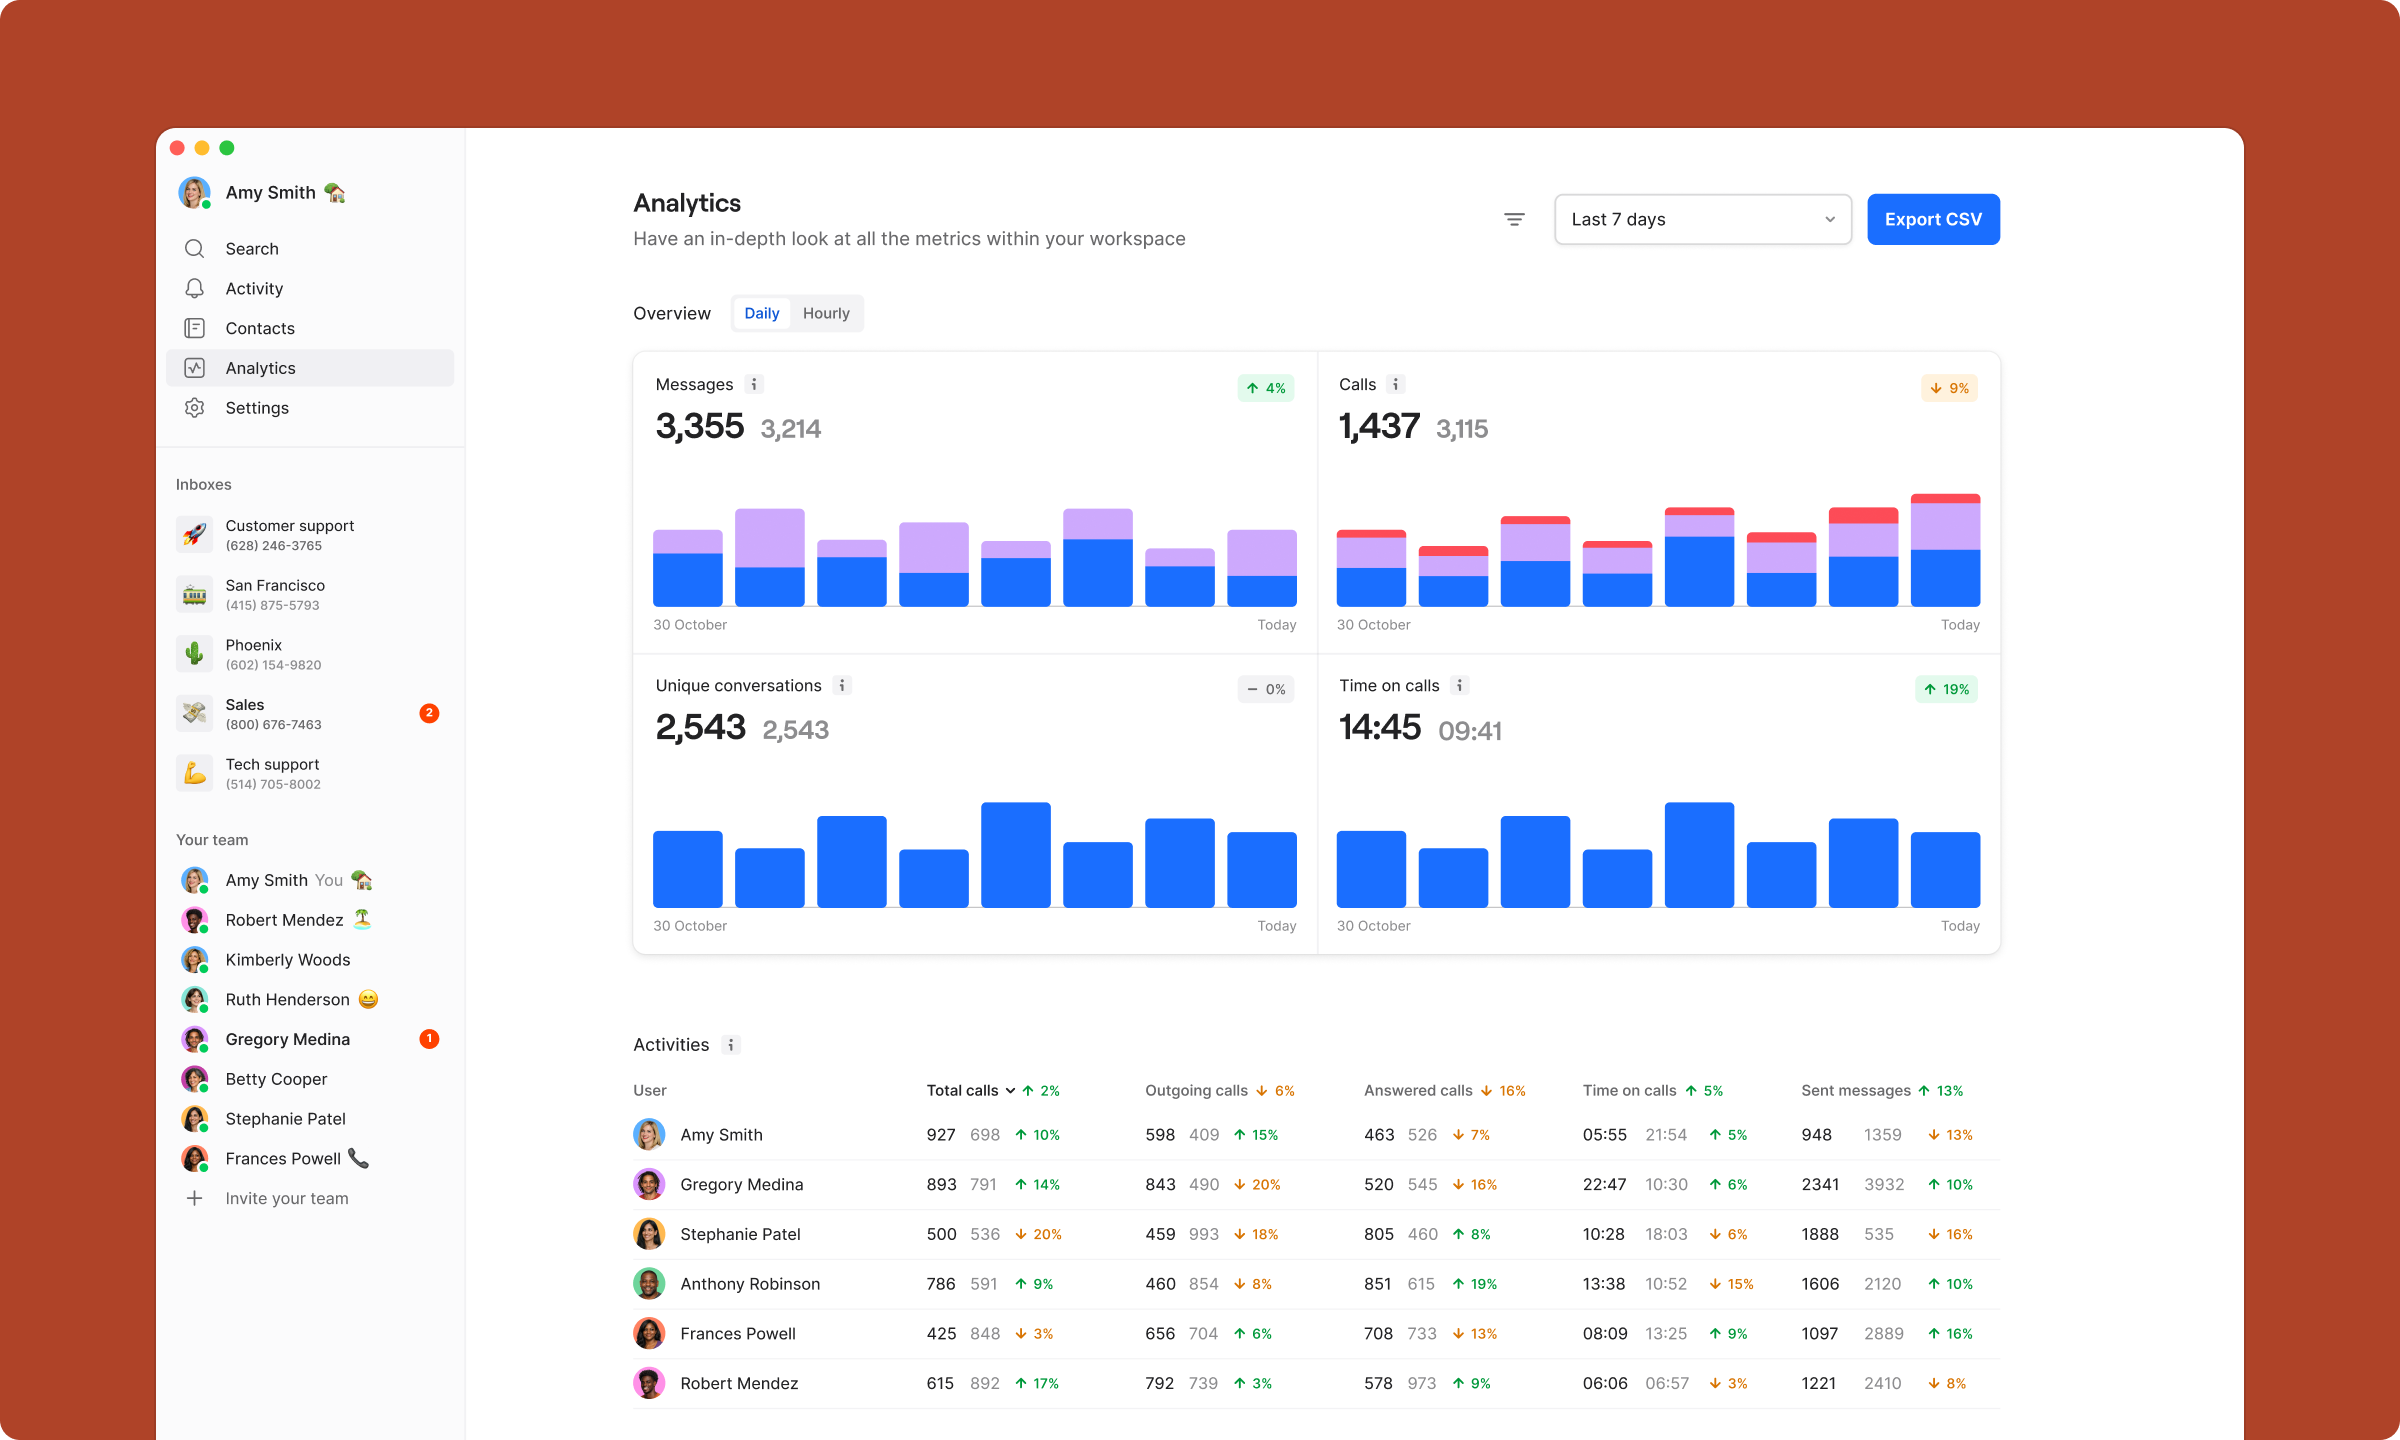
Quo's Analytics screen is organized around four headline KPIs rendered as bar charts: Messages, Calls, Unique conversations, and Time on calls. Each card shows two numbers — the current period and a comparison period — with a color-coded percentage change badge (green for improvement, red for decline). In the screenshot, Messages stand at 3,355 vs. 3,214 (up 4%), while Calls dropped from 3,115 to 1,437 (down 9%).
The dual-bar visualization inside each chart makes period-over-period comparison intuitive without requiring the user to switch views. Blue bars represent the current window; a lighter overlay or secondary bar shows the reference period. This design choice is small but meaningful: managers can spot volume trends at a glance without running a manual comparison.
Below the KPI cards sits an Activities table that breaks down performance by individual agent — Total calls, Outgoing calls, Answered calls, Time on calls, and Sent messages — each with its own trend badge. This per-rep view is where coaching conversations begin. A team lead can immediately see that Gregory Medina's total calls are up 14% while outgoing jumped 20%, signaling proactive outreach; or that Stephanie Patel's answered calls fell 20%, worth a follow-up.
Four headline KPIs, dual-bar period comparison, and a per-agent activity table — everything a team lead needs to run a Monday review without opening a spreadsheet.
Inbox structure and team visibility
Quo organizes workspaces into named inboxes, each tied to a specific phone number or communication channel. The sidebar shows five inboxes — Customer support, San Francisco, Phoenix, Sales, and Tech support — each with its own number. This structure lets operations teams segment volume by region, department, or function without building separate workspaces.
Team visibility is first-class. The left panel lists every team member with their avatar and status. Managers can see who is active, identify idle agents during peak hours, and invite new teammates directly from the sidebar. Lightweight real-time presence indicators remove the need for a separate status dashboard.
CSV export and reporting workflow
The 'Export CSV' button in the top-right corner is a simple but often undervalued feature. Analytics tools that gate raw data behind premium tiers or force users into locked dashboard views create friction for data-driven teams. Quo's one-click export means analysts can pull the full period dataset into Excel, Google Sheets, or a BI tool without API credentials or developer involvement.
The time selector defaults to 'Last 7 days' and supports Daily and Hourly tabs. Hourly granularity is particularly useful for support teams that experience predictable intraday peaks — it allows staffing decisions to be grounded in actual call-arrival patterns rather than guesswork.
Who should use Quo?
Quo is best suited for small-to-mid-sized teams (5 to 50 agents) running blended inbound/outbound communication across voice and messaging. It fits particularly well in industries where phone calls remain a primary customer channel — financial services, healthcare scheduling, local services, and inside sales.
Teams that need enterprise-grade routing, IVR configuration, or deep CRM bi-directional sync may find Quo's current feature set limiting. But for teams whose primary pain point is visibility — understanding what their agents are doing, how much volume each channel handles, and where performance is slipping — Quo's analytics module delivers a clear, low-friction answer. If your team's bottleneck is upstream of the phone — finding and enriching leads before the first call — see our review of Apollo's dashboard suite for the prospecting side of the stack.
Verdict
Quo Analytics & Oversight earns its place as a daily operational tool for communication-heavy teams. The dashboard design prioritizes the questions managers actually ask — How busy were we? Who performed? What changed week over week? — and answers them without requiring training or configuration work.
The per-agent breakdown with trend indicators is the standout feature: it surfaces performance conversations before they become performance problems. Combined with CSV export and a clean inbox structure, Quo gives growing teams the oversight layer that most off-the-shelf helpdesks lack.
If your team lives in calls and messages and you are still relying on manual tallies or ad-hoc CRM reports to understand performance, Quo's analytics module is worth a serious evaluation.
Quo gives growing teams the oversight layer that most off-the-shelf helpdesks simply lack.